Hello everyone,
this thread should become an introduction to one of the most useful things you can use to create drawings and/or custom controls in Xojo - The Graphics Object. I’ll use the API 2.0 grammar which was introduced in Xojo 2019 Release 2.
One of the main interests of my developments, besides working with databases, is the creation of custom controls. These are graphical, interactive input/output components, such as a date selection field, a family tree display, an extended text field etc. Basic for the graphical representation of these components is the Graphics object. This is a property of the Picture class. There and within the Canvas, Window and ContainerControl Paint-Event you have access to this object. The Graphics object manages all objects to be drawn. In this first post I want to give an overview of the basic drawing functions of the Graphics object.
The coordinate system
The coordinate system of Xojo consists of an x-axis, which starts horizontally at the upper edge (point 0), and a y-axis, which starts vertically at the upper edge (point 0). All methods of the Graphics object are oriented along these axes.
Color
If you want to assign a color to an object, use the Graphics.DrawingColor property.
Text output
To format text, the Graphics object provides some properties that you must initialize before calling the text drawing method.
Bold As Boolean ' sets the text in bold
CharacterSpacing As Integer ' spacing between characters in percentage
FontName As String ' sets the drawing font
FontSize As Single ' sets the font size
Italic As Boolean ' sets the text in italic
Underline As Boolean ' underlines the text
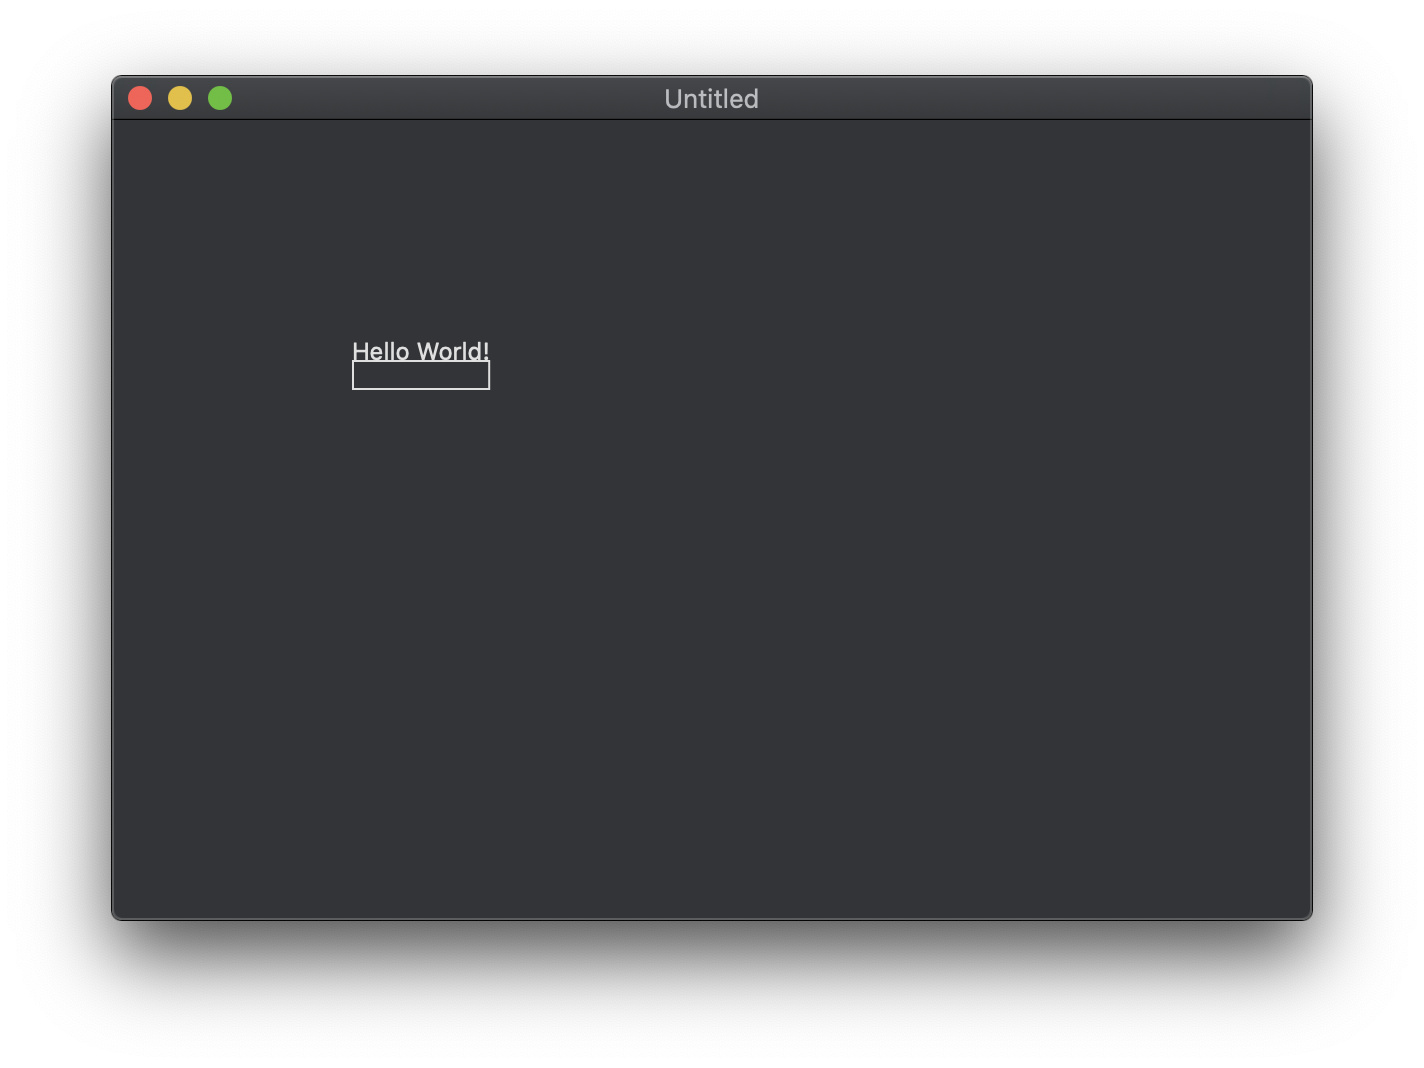
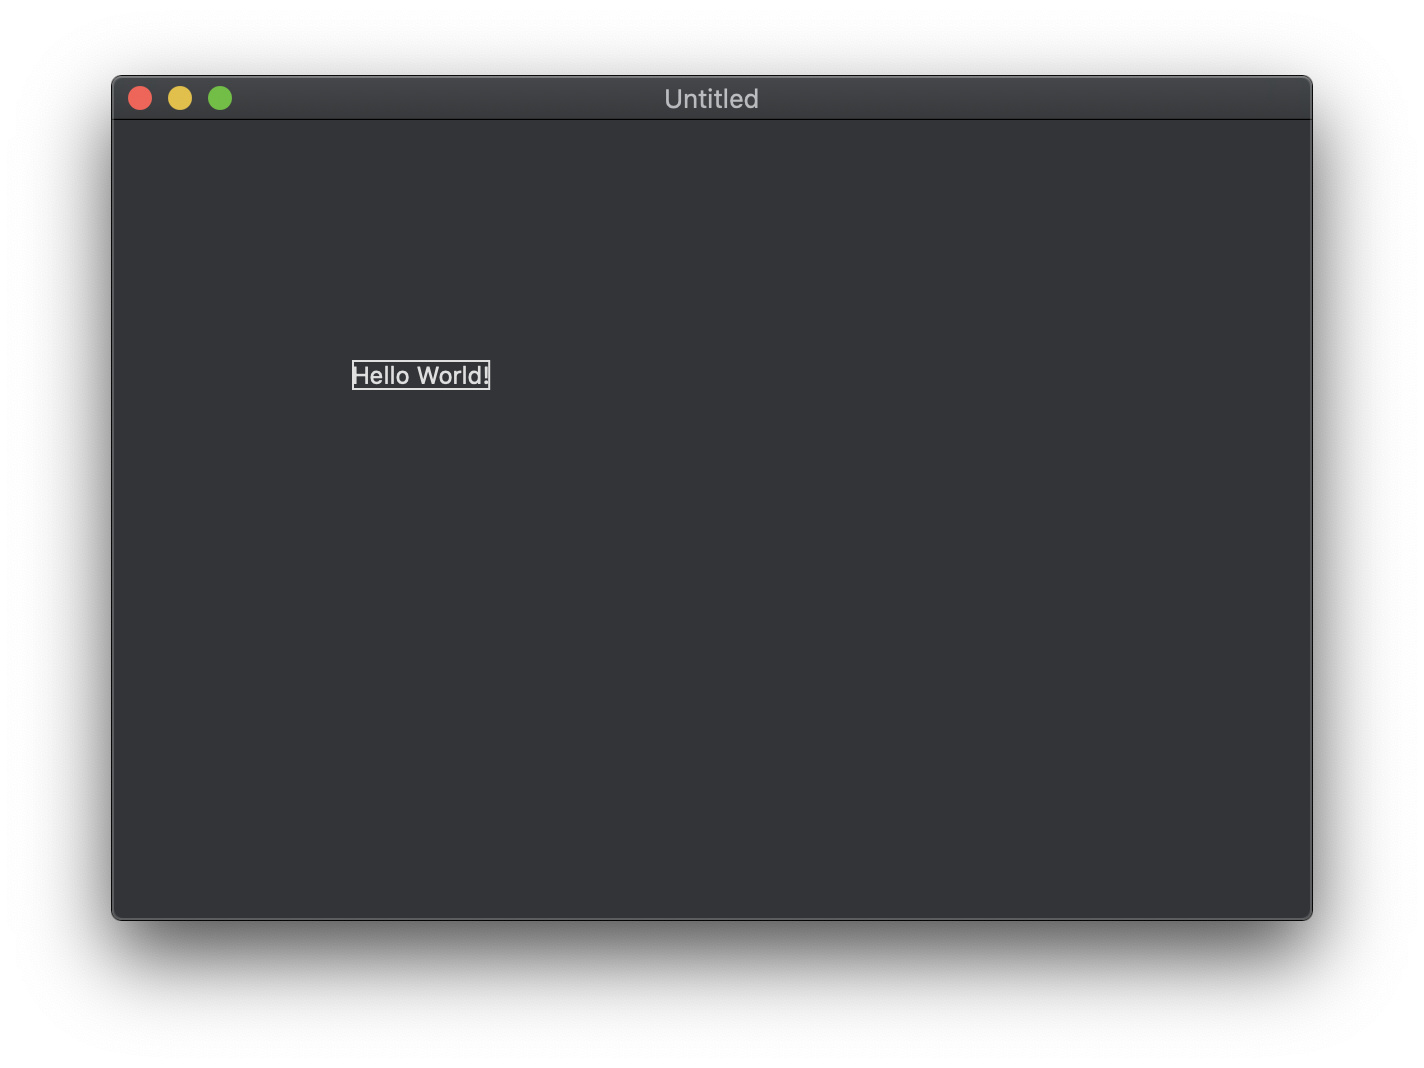
After we have set the desired properties, we now want to display our text on the screen. Simply call the Graphics.DrawText method.
' str: Text to be output
' x: Left Position
' y: Top Position (Baseline of the Text)
' wrapWidth: Width, after which text is to be wrapped to the next line in excess length
' condense: truncates the text to fit into the space specified by WrapWidth and uses an ellipsis ("...")
Graphics.DrawText(str As String, x As Double, y As Double [, wrapWidth As Double = 0] [, condense As Boolean = False])
Besides the methods that influence the output of a text, there are also functions that return certain parameters relating to your text output for further processing.
FontAscent As Double ' Returns the ascent of a line of the drawn text
TextHeight As Double ' Returns the height of a line of the drawn text
TextWidth As Double ' Returns the width of Text in points
Geometric objects
Besides the output of text, the Graphics object also offers the possibility to output geometric shapes (ovals, rectangles etc.). For this purpose, the Graphics object divides drawing routines that only paint the outline of an object and methods that paint filled objects.
' Outline Methods
DrawOval(X as Integer, Y as Integer, Width as Integer, Height as Integer)
DrawPath(path As GraphicsPath, autoClose As Boolean = False)
DrawPolygon(points() As Double)
DrawRectangle(X as Integer, Y as Integer, Width as Integer, Height as Integer)
DrawRoundRectangle(x As Double, y As Double, width As Double, height As Double, arcWidth As Double, arcHeight As Double)
Similarly, the methods that draw the objects with a fill color:
' Fill Methods
FillOval(X as Integer, Y as Integer, Width as Integer, Height as Integer)
FillPath(path As GraphicsPath, autoClose As Boolean = False)
FillPolygon(points() As Double)
FillRectangle(X as Integer, Y as Integer, Width as Integer, Height as Integer)
FillRoundRectangle(x As Double, y As Double, width As Double, height As Double, arcWidth As Double, arcHeight As Double)
Pretty self-explanatory, don’t you think?
Just play around with the Graphics object on your own and generate graphical output. Anything is possible.
This series will be continued!