I’m having a really weird issue with my iOS Swift app.
During normal usage it will happily tick along using 20-30MB of memory, however as soon as the keyboard is displayed the memory spikes to 280-300MB. This is only on iPhone (iOS 16) and seems fine on iPadOS, so that makes it even trickier to work out what’s going on.
That memory usage will remain even after the keyboard is closed and also when the View that the TextField was in is closed.
Memory usage will remain high until my app actually does something that uses a fair bit of memory, then the usage will drop. For example, my app needs to extract and display waveform data from audio files. Obviously extracting raw sample data from an audio file uses a bit of memory whilst the process is taking place. When extracting and downsampling the data my app can use upwards of 200MB of memory, but quickly drops back down to 20-30MB again after a second or so.
The funny thing is, if the memory usage is already high due to the keyboard problem, after I extract the samples, the memory will drop back to 20-30MB again, even though usage was higher than that before extracting.
So my guess is that when the garbage collection happens after the sample extraction, it’s also cleaning up whatever the issue was with the keyboard display spiking memory usage. I know Swift doesn’t strictly use garbage collection and instead uses automatic reference counting, but something is releasing that memory. I guess a reference to that memory must be being held somewhere and when I use lots of memory it’s getting released. What’s holding the reference? I’ve no idea, especially as it doesn’t happen in iPadOS.
I can’t work out what the problem is. Do you think I should just not worry about it as it seems to get tidied on its own after a while? It’s just really weird and is niggling at the back of my mind as a potential issue down the line.
It’s any TextField in my entire app, so not a code ‘sample’ as such. Give me a bit and I’ll start a new project and see if I can reproduce in a simple one window app.
I created a simple Swift app with 3 textfields… sitting idle it used 26meg… with the keyboard active it went to 49meg… closing the keyboard dropped to 40meg
Just tried to create simple app to check if I can reproduce the issue and it’s not doing it. I get the same as you with just a few MB extra when the keyboard is shown. All my TextFields are in Sheet popovers, but I tried this in the sample app and it made no difference either.
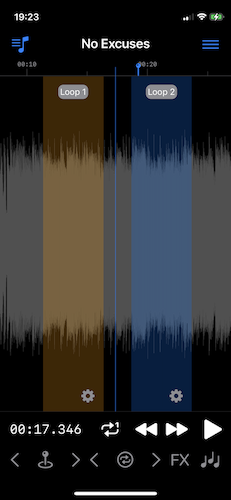
I have done some further testing and it appears to be to do with how complex the View that sits behind the sheet window is. My main View is fairly complex as it displays a large scrolling timeline with a zoomable waveform, loops and markers (see attached image), so I thought maybe the keyboard didn’t like that being in background behind the sheet. I have a mode in my app that disables all timeline updates to lower CPU usage when sheet windows are over the over the top, as I don’t need to be animating the whole timeline when you can’t see it. I tried setting that and it made no difference at all to the memory spike.
However, when I set a flag to completely hide the entire timeline View when a sheet window with a TextField is presented, that seemed to fix the issue. So it seems that having a complex View behind the sheet window and keyboard seems to be what is spiking the memory. So it’s not the updating of the background View that is the issue, it’s the very presence of it.
The odd thing is that it doesn’t happen on iPadOS. Is it perhaps because sheet Views on iPhone cover then entire screen, whereas on iPad they only fill the centre area so you can see the background View around them? Still very odd though.
What I’m probably going to do is check if the app is running on a phone and if it is, hide the timeline whenever a sheet with a form is shown. It’s not ideal, but it does seem to work. I’d rather know what is actually causing it though.
No idea how it applies (or not) to iOS but the pattern you’re describing sounds like some memory is allocated and released but not truly reclaimed at the OS level until something else pushes it aside with a large allocation. I don’t have much experience with Windows 10+ or Windows Server > 2012 but in prior Windows versions it wasn’t unusual to see what appeared to be high memory usage and it just was a question of the OS not bothering to reclaim it due to lack of need. Eventually it gets around to it.
I got the sense several years ago that the developers of Chrome were struggling with memory allocation on MacOS because of similar confusion around what reported memory usage really means (or doesn’t).
Since I’ve mostly developed on the .NET CLR for years now I have gotten used to ignoring it because memory usage is so non-deterministic in .NET that it seems like a fool’s errand to even worry about it. I focus more on minimizing transient allocations, especially of strings, as it has a tendency to keep the GC too busy and can result in performance impact through excessive garbage collection.
I tend to agree, but the question I have is why is the keyboard using so much memory when it normally does not? I wonder if SwiftUI is somehow caching the complex background view into memory or something? No idea why it would be hundreds of MB though.
I tend to think it’s more of an iOS issue rather than my app as I’m using SwiftUI, which means that it handles all of the showing and hiding of the keyboard for me automatically. Especially considering it’s fine on iPadOS.
Anyway, I’m putting my work around in place now and fingers crossed that will mean the issue doesn’t rear its head again. Thanks everyone for your input.
I didn’t get the problem with my test app in SwiftUI, so I don’t think it’s SwiftUI in general. I did look around online for a solution and the only other mention of a the same issue was someone using UIKit. They said that ‘disabling animations’ worked for them. No idea which animations though!
I have done some further investigation and it’s the actual waveform view that is causing the issue. I can have the full timeline, with ruler, loops and markers showing without causing the issue as long as I hide the waveform. The waveform is probably the biggest view in the whole app, so it’s likely something to do with that.
I’ll keep prodding at it and do some optimisations to see if I can spot anything else.
I’ve been running the Leaks template in Instruments to profile the running app for a bit now and no leaks are identified. This is with my mitigations disabled. Also, when profiling in Instruments, the persistent memory usage doesn’t jump up when the keyboard is shown in the same way that the standard debug info in Xcode does.
So maybe it’s an issue with the debug info in Xcode? Who knowns! I think I’ll call it a day at that, keep my mitigations in place for now, but stop worrying about it.